State-Specific Healthy Life Expectancy at Age 65 Years — United States, 2007–2009
From Centers for Disease Control July 19, 2013
Healthy life expectancy (HLE) is a population health measure that combines mortality data with morbidity or health status data to estimate expected years of life in good health for persons at a given age. HLE accounts for quantity and quality of life and can be used to describe and monitor the health status of populations. HLE estimates for countries have been used for predicting future health service needs, evaluating health programs, and identifying trends and inequalities (1), but to date, few studies have reported HLE at the state level for the United States (2). To determine state-level estimates, CDC used data from the National Vital Statistics Systems (NVSS), U.S. Census Bureau, and Behavioral Risk Factor Surveillance System (BRFSS) to calculate HLEs for persons aged 65 years, by sex and race, for each of the 50 states and the District of Columbia (DC). Those calculations indicate that, during 2007–2009, females had a greater HLE than males at age 65 years in every state and DC. HLE was greater for whites than for blacks in all states from which sufficient data were available and DC, except in Nevada and New Mexico. These results can be used as a baseline for states to monitor changes in the HLE of persons aged 65 years as they age and identify health disparities among subpopulations.
State-specific HLE estimates were calculated from three data sources: 1) 2007–2009 state-specific, individual-level multiple cause mortality data from NVSS; 2) 2007–2009 bridged-race, mid-year population estimates from the U.S. Census Bureau; and 3) 2007–2009 self-reported health status data from BRFSS, a state-based, telephone survey of noninstitutionalized U.S. civilian adults aged ≥18 years administered in all states and selected territories.* The BRFSS question used to assess health status was "Would you say that in general your health is excellent, very good, good, fair, or poor?" For this study, participant responses of "fair or poor" were categorized as "unhealthy" and "excellent, very good, or good" as "healthy." During 2007–2009, the BRFSS median response rate† for states ranged from 50.6% to 53.3% (3).
Life expectancy (LE) (i.e., expected years of life at a given age) is the average remaining years of life a person can expect to live on the basis of the current mortality rates for the population. HLE estimates the equivalent healthy years that a person can expect to live on the basis of the current mortality rates and prevalence distribution of health status in the population. An abridged life table method was used to estimate LE using data by 5-year age intervals (4). State-specific HLE estimates were calculated from the LE estimates and the self-reported health status data from the BRFSS.
To estimate LE, age-specific death rates were calculated using the mid-year U.S. Census population and the number of deaths in the NVSS. Age-specific death rates were used to estimate the number of survivors, the total number of person-years lived within each age interval, and the average expected years of life remaining per person at the beginning of each age interval. To estimate HLE at a given age, the prevalence of being healthy at the beginning of the age interval and the total number of person-years lived by a cohort in that age interval were calculated. The products for each age interval and for all subsequent age intervals were summed to obtain the total number of years lived in healthy state at a given age. This sum was then divided by the number of persons alive at each age interval.§
HLE estimates were calculated for persons aged 65 years, by sex (male and female) and race (white and black) for each of the 50 states and DC. States with small numbers of deaths (<700 total deaths in the period studied) in specific demographic categories were excluded from the analysis (5). HLE estimates for Hispanics, Asians, and American Indians/Alaska Natives were not presented because sufficient reliable data were not available at the state level. State estimates for HLE as a percent of LE for each age and race subpopulation were calculated. Statistical software was used to account for the complex BRFSS sampling. To assess disparities, differences in HLE were measured between subpopulations. The statistical significance of the differences was assessed using the two-tailed z-statistic and p<0.05.
For both sexes, estimated HLE generally was less in the South than elsewhere in the United States (Figure 1). HLE for males at age 65 years varied from a low of 10.1 years in Mississippi to a high of 15.0 years in Hawaii (Table). HLE for females at age 65 years varied from a low of 11.4 years in Mississippi to a high of 17.3 years in Hawaii. HLE was greater for females than for males in all states, with the difference ranging from 0.7 years in Louisiana to 3.1 years in North Dakota and South Dakota.
By race, HLE estimates for whites were lowest among southern states (Figure 2). For blacks, HLE estimates were comparatively low throughout the United States, except for a few southwestern states. For whites aged 65 years, HLE varied from a low of 11.0 years in West Virginia to a high of 18.8 years in DC. For blacks, data for 11 states were not reported because the total number of deaths during 2007–2009 for the black population in those states was <700. For the remaining states, HLE for blacks aged 65 years varied from a low of 7.1 years in Iowa to a high of 15.1 years in New Mexico. HLE was greater for whites than for blacks in most states, except in Nevada and New Mexico where, respectively, HLE for whites was 0.4 and 0.8 years less than for blacks. The largest difference in HLE between whites and blacks was 7.8 years in Iowa.
For the total population at age 65 years, HLE was lowest among southern states (Figure 3). For all persons at age 65 years, the highest HLE was observed in Hawaii (16.2 years) and the lowest was in Mississippi (10.8 years). During 2007–2009, HLE as a percentage of LE for persons at age 65 years for the total U.S. population ranged from a low of 61.5% in Mississippi to a high of 78.2% in Vermont (Table). Conversely, the number of remaining years in fair or poor health for persons aged 65 years was 6.7 out of 17.5 years of LE for those living in Mississippi and 4.2 years out of 19.4 years for those living in Vermont.
* * * * *
AP: Golden years shorter, sicker in the South; La. men, women fare nearly the same
What is already known on this topic?
Healthy life expectancy (HLE) is a population health measure that combines age-specific mortality with morbidity or health status to estimate expected years of life in good health for persons at a given age. HLE reflects both quality and quantity of life and might be useful in describing and monitoring the health status of a population. Although national HLE estimates for the U.S. population have been reported previously, limited data have been available on estimates at the state level and by demographic characteristics.
What is added by this report?
In this report, differences in HLE were reported at the state level for adults aged 65 years based on self-reported health in the 2007–2009 Behavioral Risk Factor Surveillance System survey, National Vital Statistics Systems mortality data, and corresponding U.S. Census population estimates. The HLE estimates identify disparities in health status by sex, race, and state. Overall, at age 65 years, females had a greater HLE than males and whites had a greater HLE than blacks in all states with sufficient data and the District of Columbia, except in Nevada and New Mexico.
What are the implications for public health practice?
HLE is a relatively simple measure that can be readily used by public health officials, health-care providers, and policy makers to monitor trends in the health of populations and identify health inequalities. The results presented in this study can be used as a baseline for states to monitor changes in the HLE of persons aged 65 years as they age and to identify health disparities among subpopulations by state.
FIGURE 1. State-specific healthy life expectancy in years at age 65 years, by sex — United States, 2007–2009
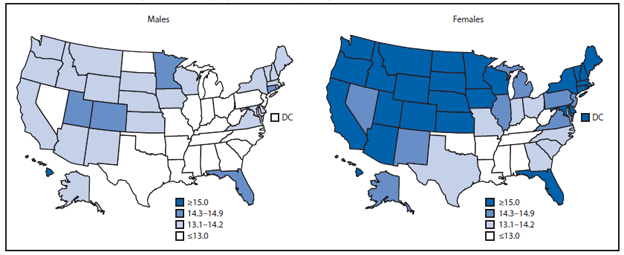
Alternate Text: The figure above shows state-specific healthy life expectancy (HLE) in years at age 65 years, by sex, in the United States during 2007-2009. For both sexes, estimated HLE generally was less in the South than elsewhere in the United States.
|
State
|
All races
|
Sex
|
Race
|
|
Both sexes
|
Male
|
Female
|
White
|
Black
|
|
LE
|
HLE
|
(%*)
|
LE
|
HLE†
|
(%)
|
LE
|
HLE†
|
(%)
|
LE
|
HLE§
|
(%)
|
LE
|
HLE§
|
(%)
|
|
Alabama
|
17.6
|
11.1
|
(63.0)
|
16.1
|
10.3
|
(64.2)
|
18.9
|
11.7
|
(62.1)
|
17.8
|
11.7
|
(65.7)
|
16.8
|
8.4
|
(50.1)
|
|
Alaska
|
19.1
|
14.1
|
(73.9)
|
18.0
|
13.3
|
(73.7)
|
20.2
|
14.9
|
(73.5)
|
19.5
|
14.7
|
(75.7)
|
—¶
|
—
|
—
|
|
Arizona
|
20.2
|
15.0
|
(74.6)
|
18.9
|
13.7
|
(72.4)
|
21.3
|
16.3
|
(76.4)
|
20.1
|
15.2
|
(75.4)
|
19.4
|
12.9
|
(66.4)
|
|
Arkansas
|
18.1
|
12.2
|
(67.4)
|
16.6
|
11.6
|
(69.5)
|
19.3
|
12.7
|
(65.8)
|
18.2
|
12.4
|
(68.1)
|
16.7
|
9.4
|
(56.1)
|
|
California
|
20.3
|
14.7
|
(72.6)
|
18.9
|
13.8
|
(73.0)
|
21.5
|
15.5
|
(72.3)
|
20.0
|
15.0
|
(74.9)
|
18.2
|
11.5
|
(63.4)
|
|
Colorado
|
19.8
|
15.3
|
(77.4)
|
18.5
|
14.3
|
(77.4)
|
20.9
|
16.2
|
(77.4)
|
19.7
|
16.4
|
(83.1)
|
19.2
|
14.0
|
(72.6)
|
|
Connecticut
|
20.2
|
15.7
|
(77.5)
|
18.7
|
14.3
|
(76.5)
|
21.3
|
16.7
|
(78.3)
|
20.2
|
15.8
|
(78.3)
|
20.1
|
12.0
|
(59.6)
|
|
Delaware
|
19.2
|
14.7
|
(76.8)
|
17.9
|
13.5
|
(75.3)
|
20.2
|
15.7
|
(77.8)
|
19.2
|
15.0
|
(78.1)
|
18.5
|
12.2
|
(65.6)
|
|
District of Columbia
|
19.0
|
14.1
|
(74.4)
|
17.1
|
13.0
|
(76.2)
|
20.5
|
15.0
|
(73.4)
|
21.7
|
18.8
|
(86.8)
|
17.6
|
11.7
|
(66.5)
|
|
Florida
|
20.4
|
15.4
|
(75.3)
|
19.0
|
14.3
|
(75.3)
|
21.7
|
16.4
|
(75.3)
|
20.5
|
15.9
|
(77.3)
|
19.1
|
11.7
|
(61.5)
|
|
Georgia
|
18.2
|
12.4
|
(68.4)
|
16.7
|
11.6
|
(69.3)
|
19.4
|
13.1
|
(67.6)
|
18.3
|
13.0
|
(70.8)
|
17.3
|
10.7
|
(61.8)
|
|
Hawaii
|
21.3
|
16.2
|
(75.9)
|
19.3
|
15.0
|
(77.7)
|
23.2
|
17.3
|
(74.6)
|
20.6
|
16.5
|
(80.0)
|
—
|
—
|
—
|
|
Idaho
|
19.4
|
14.2
|
(73.3)
|
18.3
|
13.1
|
(71.5)
|
20.3
|
15.1
|
(74.6)
|
19.3
|
14.2
|
(73.4)
|
—
|
—
|
—
|
|
Illinois
|
19.1
|
13.5
|
(70.8)
|
17.6
|
12.6
|
(71.5)
|
20.3
|
14.3
|
(70.5)
|
19.2
|
13.8
|
(72.1)
|
17.7
|
11.4
|
(64.5)
|
|
Indiana
|
18.5
|
13.2
|
(71.5)
|
17.0
|
12.2
|
(71.6)
|
19.7
|
14.1
|
(71.5)
|
18.5
|
13.4
|
(72.4)
|
17.7
|
10.4
|
(59.1)
|
|
Iowa
|
19.4
|
14.8
|
(76.4)
|
17.8
|
13.4
|
(75.3)
|
20.7
|
15.9
|
(77.1)
|
19.4
|
14.9
|
(76.7)
|
17.4
|
7.1
|
(40.9)
|
|
Kansas
|
19.0
|
14.2
|
(75.0)
|
17.6
|
13.1
|
(74.8)
|
20.1
|
15.1
|
(75.2)
|
19.0
|
14.4
|
(75.6)
|
17.4
|
11.2
|
(64.1)
|
|
Kentucky
|
17.6
|
11.0
|
(62.1)
|
16.2
|
10.2
|
(63.2)
|
18.9
|
11.6
|
(61.5)
|
17.7
|
12.2
|
(68.9)
|
16.8
|
9.4
|
(56.2)
|
|
Louisiana
|
17.9
|
12.0
|
(67.1)
|
16.4
|
11.6
|
(70.4)
|
19.0
|
12.3
|
(64.8)
|
18.1
|
12.7
|
(70.4)
|
16.9
|
9.2
|
(54.1)
|
|
Maine
|
19.0
|
14.7
|
(77.3)
|
17.5
|
13.5
|
(77.0)
|
20.2
|
15.7
|
(77.5)
|
19.0
|
14.7
|
(77.7)
|
—
|
—
|
—
|
|
Maryland
|
19.2
|
14.4
|
(75.1)
|
17.8
|
13.3
|
(75.0)
|
20.4
|
15.3
|
(75.2)
|
19.3
|
14.8
|
(76.7)
|
18.2
|
12.5
|
(68.7)
|
|
Massachusetts
|
19.7
|
15.0
|
(76.1)
|
18.2
|
13.8
|
(76.0)
|
20.9
|
15.9
|
(76.2)
|
19.6
|
15.1
|
(77.4)
|
21.1
|
12.8
|
(60.7)
|
|
Michigan
|
18.8
|
13.9
|
(73.6)
|
17.4
|
12.8
|
(73.7)
|
20.0
|
14.7
|
(73.6)
|
18.9
|
14.3
|
(75.3)
|
17.6
|
10.6
|
(60.0)
|
|
Minnesota
|
20.1
|
15.6
|
(77.5)
|
18.6
|
14.3
|
(76.7)
|
21.4
|
16.7
|
(78.2)
|
20.2
|
15.6
|
(77.4)
|
20.2
|
11.5
|
(56.9)
|
|
Mississippi
|
17.5
|
10.8
|
(61.5)
|
15.8
|
10.1
|
(63.9)
|
19.0
|
11.4
|
(59.9)
|
17.9
|
11.8
|
(66.0)
|
16.6
|
8.2
|
(49.2)
|
|
Missouri
|
18.5
|
13.0
|
(70.2)
|
17.1
|
11.7
|
(68.8)
|
19.6
|
14.0
|
(71.1)
|
18.5
|
13.2
|
(71.3)
|
17.4
|
10.0
|
(57.3)
|
|
Montana
|
19.2
|
14.6
|
(75.9)
|
18.1
|
13.4
|
(74.1)
|
20.2
|
15.6
|
(77.2)
|
19.3
|
14.7
|
(76.4)
|
—
|
—
|
—
|
|
Nebraska
|
19.3
|
14.5
|
(75.3)
|
17.9
|
13.1
|
(73.1)
|
20.4
|
15.7
|
(76.7)
|
19.3
|
14.7
|
(75.9)
|
17.3
|
9.1
|
(52.4)
|
|
Nevada
|
18.7
|
13.7
|
(73.2)
|
17.4
|
12.8
|
(73.3)
|
19.9
|
14.5
|
(73.1)
|
18.4
|
13.6
|
(74.2)
|
18.8
|
14.0
|
(74.5)
|
|
New Hampshire
|
19.4
|
15.1
|
(77.8)
|
18.0
|
14.0
|
(77.5)
|
20.6
|
16.0
|
(77.9)
|
19.3
|
15.1
|
(77.9)
|
—
|
—
|
—
|
|
New Jersey
|
19.6
|
14.0
|
(71.2)
|
18.1
|
12.9
|
(71.4)
|
20.8
|
14.8
|
(70.9)
|
19.6
|
14.4
|
(73.5)
|
18.5
|
10.8
|
(58.6)
|
|
New Mexico
|
19.6
|
13.9
|
(71.0)
|
18.4
|
13.1
|
(71.2)
|
20.8
|
14.7
|
(70.8)
|
19.6
|
14.3
|
(72.8)
|
19.8
|
15.1
|
(76.5)
|
|
New York
|
20.0
|
14.5
|
(72.5)
|
18.5
|
13.6
|
(73.5)
|
21.2
|
15.3
|
(71.9)
|
19.8
|
14.8
|
(75.0)
|
20.6
|
12.2
|
(59.0)
|
|
North Carolina
|
18.6
|
12.7
|
(68.3)
|
17.1
|
11.7
|
(68.5)
|
19.8
|
13.5
|
(68.1)
|
18.8
|
13.3
|
(70.6)
|
17.6
|
10.1
|
(57.2)
|
|
North Dakota
|
19.9
|
14.6
|
(73.5)
|
18.1
|
12.9
|
(71.6)
|
21.5
|
16.0
|
(74.6)
|
20.0
|
14.8
|
(74.0)
|
—
|
—
|
—
|
|
Ohio
|
18.5
|
13.2
|
(71.4)
|
17.0
|
12.2
|
(71.5)
|
19.6
|
14.0
|
(71.4)
|
18.5
|
13.4
|
(72.5)
|
17.4
|
9.7
|
(55.6)
|
|
Oklahoma
|
17.7
|
12.0
|
(67.6)
|
16.4
|
10.8
|
(66.0)
|
18.8
|
12.9
|
(68.7)
|
17.8
|
12.3
|
(69.2)
|
16.7
|
9.9
|
(59.3)
|
|
Oregon
|
19.3
|
15.0
|
(77.9)
|
18.0
|
13.9
|
(77.3)
|
20.4
|
16.0
|
(78.3)
|
19.3
|
15.0
|
(78.1)
|
18.9
|
12.4
|
(65.6)
|
|
Pennsylvania
|
18.9
|
13.9
|
(73.6)
|
17.4
|
12.8
|
(73.8)
|
20.2
|
14.8
|
(73.5)
|
19.0
|
14.1
|
(74.4)
|
17.6
|
11.5
|
(65.2)
|
|
Rhode Island
|
19.4
|
14.5
|
(74.7)
|
17.8
|
13.1
|
(73.7)
|
20.7
|
15.6
|
(75.3)
|
19.4
|
14.6
|
(75.2)
|
21.9
|
14.6
|
(66.5)
|
|
South Carolina
|
18.5
|
12.9
|
(69.7)
|
16.9
|
12.0
|
(70.6)
|
19.7
|
13.6
|
(69.0)
|
18.8
|
13.7
|
(73.2)
|
17.2
|
9.8
|
(57.0)
|
|
South Dakota
|
19.8
|
15.0
|
(75.6)
|
18.0
|
13.3
|
(74.0)
|
21.3
|
16.4
|
(76.7)
|
20.0
|
15.2
|
(76.0)
|
—
|
—
|
—
|
|
Tennessee
|
18.0
|
11.9
|
(66.2)
|
16.5
|
11.2
|
(68.0)
|
19.2
|
12.5
|
(65.1)
|
18.1
|
12.0
|
(66.5)
|
16.6
|
10.3
|
(62.3)
|
|
Texas
|
18.9
|
12.9
|
(68.4)
|
17.5
|
12.2
|
(69.8)
|
20.0
|
13.4
|
(67.3)
|
18.9
|
13.6
|
(72.1)
|
17.2
|
10.6
|
(61.9)
|
|
Utah
|
19.8
|
15.0
|
(75.7)
|
18.9
|
14.3
|
(75.7)
|
20.7
|
15.7
|
(75.9)
|
19.8
|
15.0
|
(76.0)
|
—
|
—
|
—
|
|
Vermont
|
19.4
|
15.2
|
(78.2)
|
18.0
|
13.9
|
(77.4)
|
20.6
|
16.2
|
(78.8)
|
19.4
|
15.2
|
(78.5)
|
—
|
—
|
—
|
|
Virginia
|
18.9
|
14.2
|
(74.9)
|
17.5
|
13.3
|
(76.2)
|
20.1
|
14.9
|
(74.0)
|
19.1
|
14.4
|
(75.7)
|
17.5
|
11.7
|
(66.9)
|
|
Washington
|
19.4
|
15.1
|
(77.6)
|
18.1
|
14.0
|
(77.3)
|
20.5
|
16.0
|
(77.9)
|
19.3
|
15.1
|
(78.2)
|
18.7
|
11.0
|
(58.9)
|
|
West Virginia
|
17.5
|
11.0
|
(63.0)
|
16.2
|
10.3
|
(64.1)
|
18.6
|
11.6
|
(62.3)
|
17.5
|
11.0
|
(63.1)
|
16.8
|
10.0
|
(59.8)
|
|
Wisconsin
|
19.5
|
14.9
|
(76.4)
|
18.0
|
13.4
|
(74.7)
|
20.8
|
16.1
|
(77.6)
|
19.6
|
15.0
|
(76.7)
|
17.6
|
12.2
|
(69.5)
|
|
Wyoming
|
19.0
|
14.4
|
(75.8)
|
17.9
|
13.7
|
(76.3)
|
20.1
|
15.2
|
(75.5)
|
19.1
|
14.5
|
(76.2)
|
—
|
—
|
—
|
|
State average**
|
19.1
|
13.9
|
(72.7)
|
17.7
|
12.9
|
(72.7)
|
20.3
|
14.8
|
(72.7)
|
19.2
|
14.3
|
(74.5)
|
18.1
|
11.1
|
(61.0)
|
FIGURE 2. State-specific healthy life expectancy in years at age 65 years, by race — United States, 2007–2009*
Alternate Text:The figure above shows state-specific healthy life expectancy (HLE) in years at age 65 years, by race, in the United States during 2007-2009. By race, HLE estimates for whites were lowest among southern states. For blacks, HLE estimates were comparatively low throughout the United States, except for a few southwestern states. For whites aged 65 years, HLE varied between a low of 11.0 years in West Virginia and a high of 18.8 years in DC.
FIGURE 3. State-specific healthy life expectancy in years at age 65 years —United States, 2007–2009
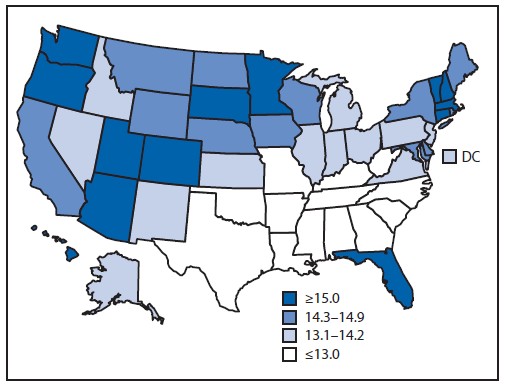
Alternate Text: The figure above shows state-specific healthy life expectancy in years at age 65 years in the United States during 2007-2009. For the total population at age 65 years, HLE was lowest among southern states. For all persons at age 65 years, the highest HLE was observed in Hawaii (16.2 years) and the lowest was in Mississippi (10.8 years).