Detailed Look at Native Hawaiian and Other Pacific Islander Groups
Chuukese and Papua New Guinean Populations Fastest Growing Pacific Islander Groups in 2020
by Brittany Rico, Joyce Key Hahn, and Paul Jacobs, US Census Bureau, Sept 21, 2023
Newly released results from the 2020 Census Detailed Demographic and Housing Characteristics File A show that the populations of nearly all the 31 detailed Native Hawaiian and Other Pacific Islander (NHPI) groups grew over the past decade.
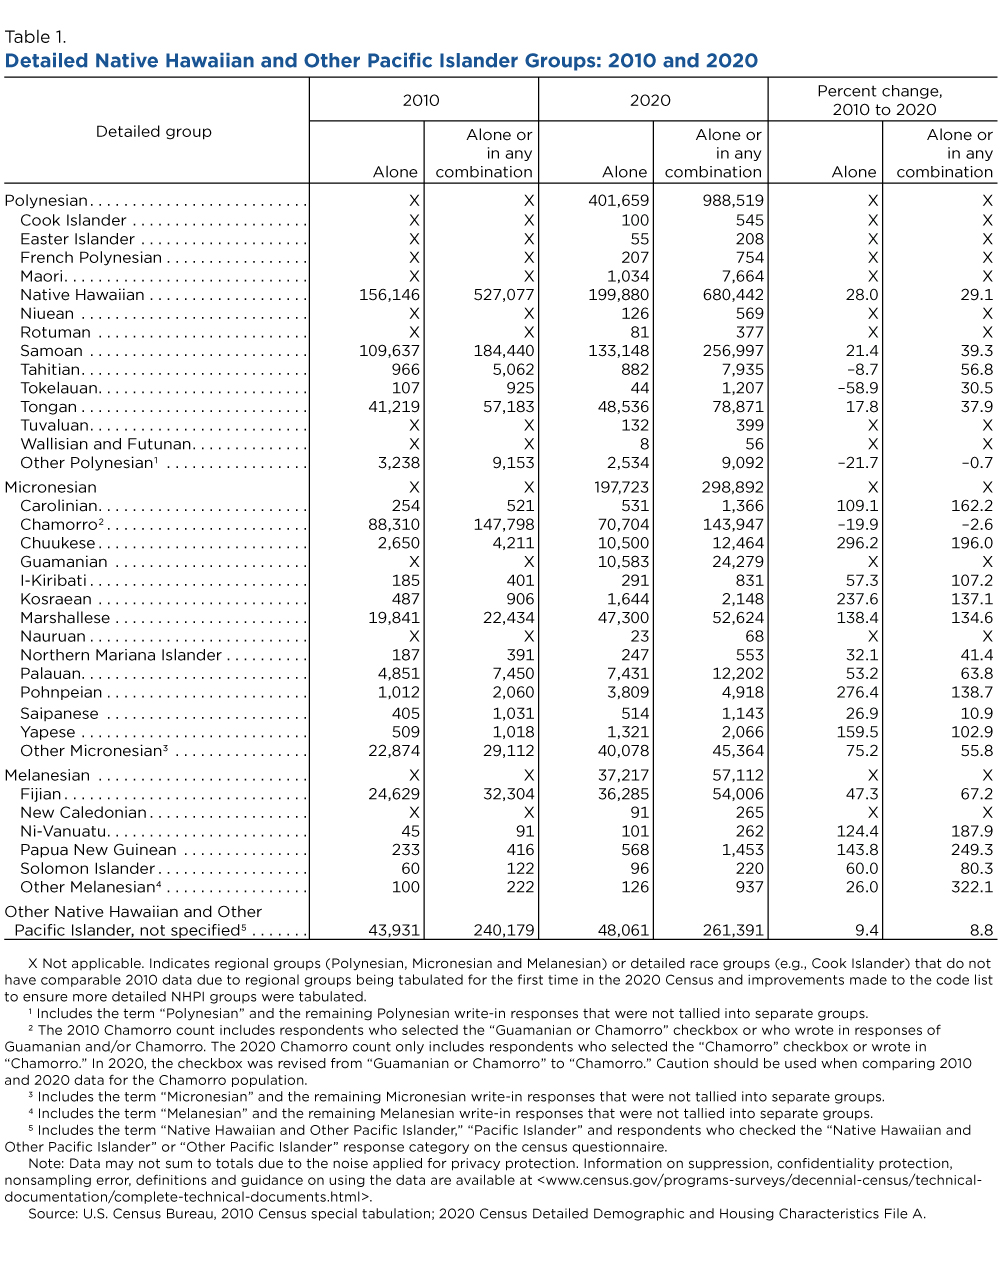
The Chuukese alone population was the fastest growing NHPI alone group, increasing 296.2% to 10,500 people from 2010 to 2020, according to the 2020 Census data released today.
Nearly all detailed NHPI groups grew over the decade. Detailed NHPI alone or in any combination groups with smaller populations in 2010 (less than 50,000) tended to grow faster over the decade.
The fastest growing NHPI alone or in any combination group was the Papua New Guinean alone or in any combination population, which increased by 249.3%, to 1,453 people during the same period.
In this article, we discuss data from the race question on detailed race alone and race alone or in any combination populations.
The race alone population represents the minimum number of people who identified as that detailed group, and includes respondents who reported one response, such as Native Hawaiian.
The race alone or in any combination population includes respondents who reported one response, such as Native Hawaiian, and those who reported more than one, such as Native Hawaiian and Samoan or Native Hawaiian and Asian. The race alone or in any combination population represents the maximum number of people who identified as that detailed group.
This information is important to frame the discussion of racial and ethnic composition and help us understand our country’s changing demographics as it becomes much more multiracial.
Change in Detailed NHPI Groups: 2010-2020
Nearly all detailed NHPI groups grew over the decade. Detailed NHPI alone or in any combination groups with smaller populations in 2010 (less than 50,000) tended to grow faster over the decade.
The Papua New Guinean, Chuukese, Ni-Vanuatu, Carolinian, Pohnpeian, Kosraean, Marshallese, I-Kiribati and Yapese alone or in any combination populations more than doubled, increasing more than 100% in 2020.
Detailed NHPI groups with larger populations in 2010 (greater than 50,000) more frequently grew at slower rates but remained the largest detailed NHPI groups in 2020.
The Native Hawaiian alone or in any combination population grew by 29.1% from 527,077 in 2010 to 680,442 in 2020. It remained the largest NHPI alone or in any combination group in 2020, comprising nearly 43% of the NHPI alone or in combination population [PDF <1.0 MB] in the United States.
The Native Hawaiian alone population was also the largest NHPI alone group (199,880 or 29.0%) and grew 28.0% between 2010 and 2020.
The Samoan population continued to be the second-largest detailed NHPI alone or in any combination group (256,997) and the second-largest detailed NHPI alone group (133,148), representing 16.2% of the NHPI alone or in combination population and 19.3% of the NHPI alone population.
The Samoan alone population grew by 21.4% and the Samoan alone or in any combination population grew by 39.3%.
Chamorro was the third-largest detailed NHPI group, with 10.2% of the NHPI alone population identifying as Chamorro alone (70,704) and 9.1% of the NHPI alone or in combination population identifying as Chamorro alone or in any combination (143,947).
The Chamorro population was the only detailed NHPI group that experienced population loss in both their alone (down 19.9%) and alone or in any combination (down 2.6%) populations. These declines are not surprising because of the improvements made to the 2020 Census to disaggregate data for the Chamorro and Guamanian populations and may also be related to demographic changes over the past ten years.
The next largest detailed NHPI alone or in any combination groups were Tongan, Fijian and Marshallese, which all had populations over 50,000.
To learn more about the 2020 population size of all NHPI groups for the nation, states and counties, view the Detailed Races and Ethnicities in the United States and Puerto Rico: 2020 Census data visualization.

Detailed NHPI Population Shifts in States
The proportions of several detailed NHPI groups living in California and Hawaii declined while the shares of these populations increased in other states across the country.
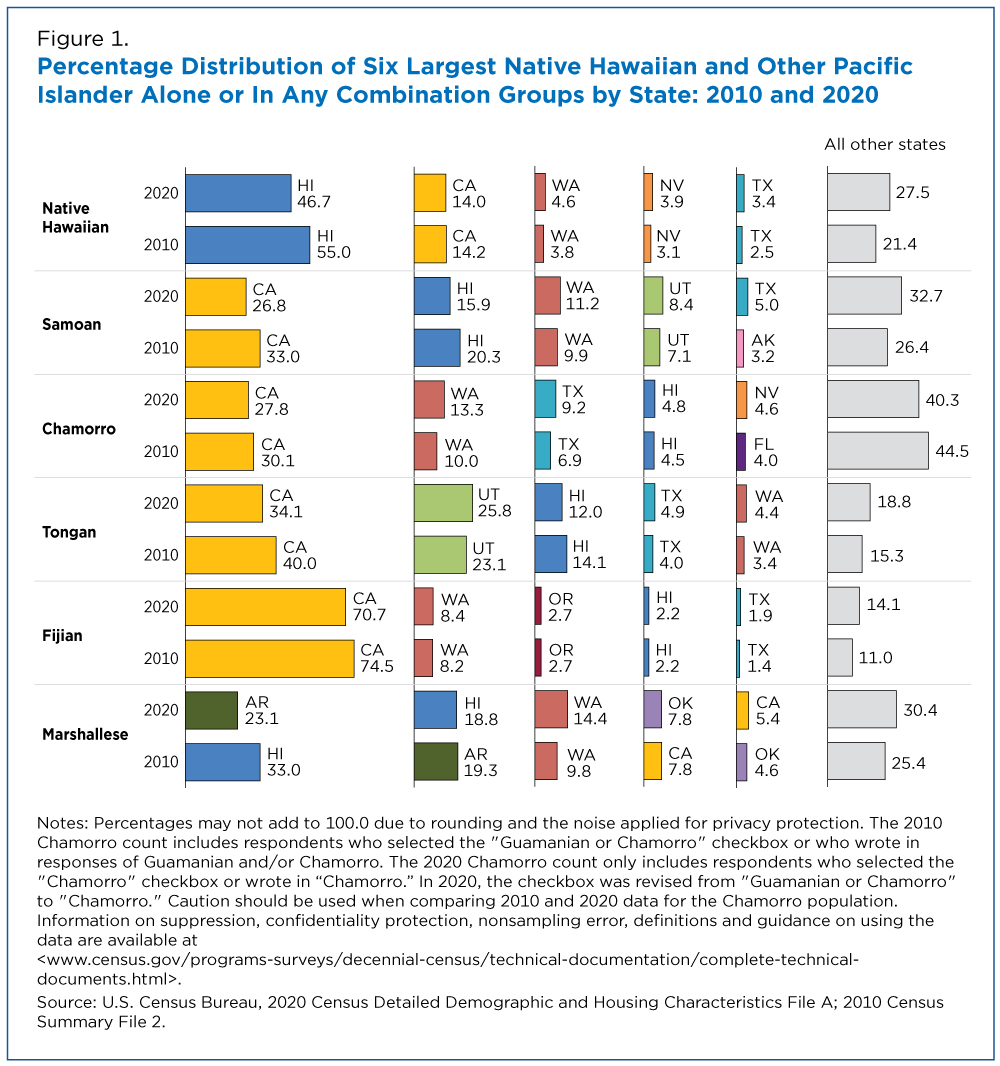
Arkansas had the largest proportion of the Marshallese alone or in any combination population in the country, which was a change from 2010 when the largest share was in Hawaii.
From 2010 to 2020, the share of the Marshallese population living in Hawaii dropped from 33.0% to 18.8%, while the share living in Arkansas increased from 19.3% to 23.1%.
California had the largest proportions of the Samoan, Chamorro, Tongan and Fijian alone or in any combination populations in the country, though the shares of these populations living in the state declined.
Less than half of the Native Hawaiian alone or in any combination population lived in Hawaii (46.7%) in 2020, down from 55.0% in 2010.
Only one of the six largest NHPI groups had its population concentrated in one state in 2020: Over 70% of the Fijian alone or in any combination population lived in California and no other state had more than 10% of this group.

Honolulu County Had the Nation’s Largest Native Hawaiian Population in 2020
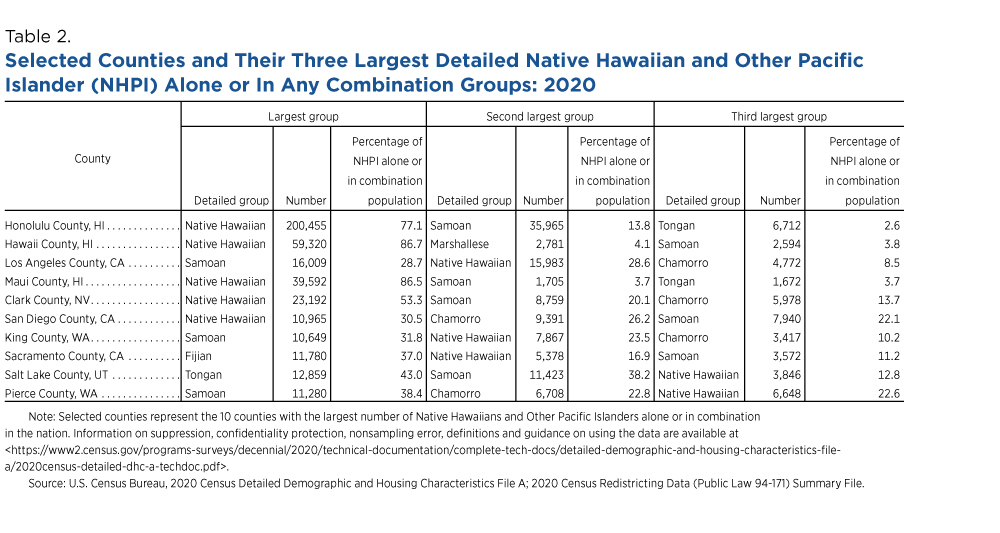
Native Hawaiian alone or in any combination was one of the three largest detailed NHPI groups reported in all 10 counties with the largest NHPI alone or in combination populations in the country (Table 2). Marshallese and Fijian were the only groups to appear just once.
Honolulu, Hawaii and Maui counties had the largest, second-largest, and fourth-largest NHPI alone or in combination populations, respectively. In these counties, the Native Hawaiian population was the largest NHPI group, with more than 75% of all NHPI respondents identifying as Native Hawaiian alone or in any combination.
Several other counties that were among the top 10 counties where NHPI populations resided all showed different compositions:
The largest Fijian population in the U.S. (11,780) was in Sacramento County, California. The Fijian population was also the largest NHPI alone or in any combination group in this county.
The Chamorro population in San Diego County, California, was the nation’s largest (9,391) and accounted for the second-largest NHPI alone or in any combination group in that county.
The Tongan population was largest (12,859) in Salt Lake County, Utah, and accounted for the largest NHPI alone or in any combination group in that county.
The Samoan population in Honolulu County, Hawaii was the largest in the nation (35,965) and was the second-largest NHPI alone or in any combination group in that county.

Data comparisons between the 2020 Census and 2010 Census race data should be made with caution, taking into account the improvements we have made to the race question and the ways we code what people tell us.
---30---
SN: Census: Most Native Hawaiians live on continent (spectrumlocalnews.com)
HNN: US Census shows majority of Native Hawaiians now live outside of Hawaii